typescript - vue3+ts+echarts的问题?
问题描述:
<template>
  <div>
    <div style="height: calc(100vh - 190px);width:100%" ref="chartsMonitorRef"></div>
  </div>
</template>

<script lang='ts' setup>
import {ref,reactive,onMounted,onActivated,nextTick,toRefs,watch,watchEffect} from 'vue'
import * as echarts from 'echarts';
import {getLocalTime} from '/@/utils/publicMethod'

const chartsMonitorRef = ref();
interface Props {
    CpuChartData: {timestamp: number;value:number}[]
}

let props = defineProps<Props>()
const {CpuChartData} = toRefs(props)

watch(
  () => props.CpuChartData,
  (newProps) => {
    initChartsMonitor()
  }
)
const state = reactive({
    myCharts: [] as EmptyArrayType,
});
onMounted(() => {
  initChartsMonitor()
  initEchartsResize();
})
onActivated(() => {
    initEchartsResizeFun();
});
const initEchartsResizeFun = () => {
    nextTick(() => {
        for (let i = 0; i < state.myCharts.length; i++) {
            state.myCharts[i].resize();
        }
    });
};
const initEchartsResize = () => {
    window.addEventListener('resize', initEchartsResizeFun);
};

const initChartsMonitor = () => {
  let myChart = echarts.getInstanceByDom(chartsMonitorRef.value);
  if(myChart==null){
    myChart = echarts.init(chartsMonitorRef.value);
  }
  myChart.showLoading({
    text: '加载中',
    color: '#c23531',
    textColor: '#000',
    maskColor: 'rgba(255, 255, 255, 0.8)',
    zlevel: 0,
  });
  const data = (() => {
    let res: string[] = [];
    CpuChartData.value.forEach((item) => {
      res.push(String(item.value.toFixed(1)))
    })
    return res;
  })();
  const categories = (function () {
    let res: string[] = [];
    CpuChartData.value.forEach((item) => {
      res.push(getLocalTime(item.timestamp))
    })
    return res;
  })();
  const option = {
    legend: {},
    grid: {
            top: 30,
            right: 30,
            bottom: 80,
            left: '5%',
        },
    tooltip: {
      trigger: 'axis',
      axisPointer: {
        type: 'cross',
        label: {
          backgroundColor: '#283b56'
        }
      },
      formatter: function (params: any) {
        var relVal = 'CPU'
        for (var i = 0, l = params.length; i < l; i++) {
          relVal += '<br/>' + params[i].marker +params[i].name+ ': ' + params[i].value + '%'
        }
        return relVal
      }
    },
    dataZoom:[{
      show: true,
      start: 0,
      end: 100,
      maxSpan: 100,
    }],
    xAxis: {
      type: 'category',
      boundaryGap: true,
      data: categories.map(function (str) {
        return str.replace(' ', '\n')
      }),
      splitLine: {
        show: true
      }
    },
    yAxis: {
      type: 'value',
      axisLine: {
        show: true
      },
      axisLabel: {
        formatter: function(_value: any) {
          return _value.toFixed(1) + '%'
        }
      }
    },
    series: [
      {
        type: 'line',
        data: data,
        lineStyle: {
          width: 1,
          color: '#f28e2b'
        },
        itemStyle: {
          color: '#f28e2b',
          borderColor: '#f28e2b'
        },
        showSymbol: false,
        areaStyle: {
          opacity: .8,
          color: new echarts.graphic.LinearGradient(0, 0, 0, 1, [
            {
              offset: 0,
              color: '#f28e2b'
            }
          ])
        },
      }
    ]
  };
    myChart.setOption(option);
  myChart.hideLoading()
    state.myCharts.push(myChart);
};
</script>
<style scoped>
</style>
这是我写的echarts组件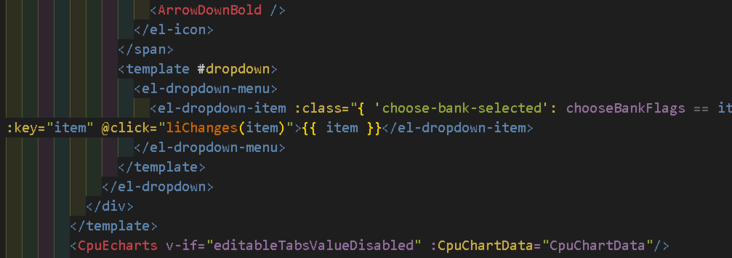
在父组件里面去调用这个组件,并传值
在父组件里面使用wtach监听日周月的变化,然后从新进行CpuChartData值的获取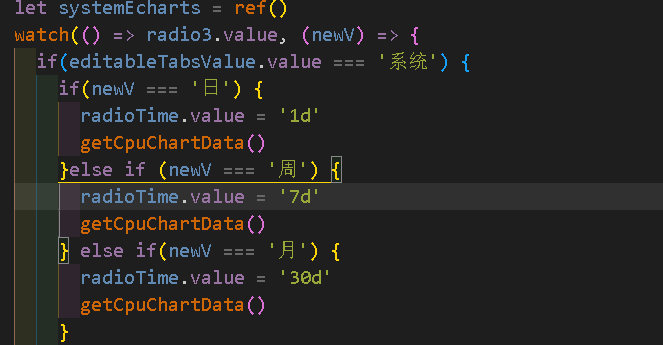
现在是想在每次发起请求获取值的时候,echarts有一个加载loading的动画
可不可以提供一个思路或者方法,请指教一下
第 1 个答案:
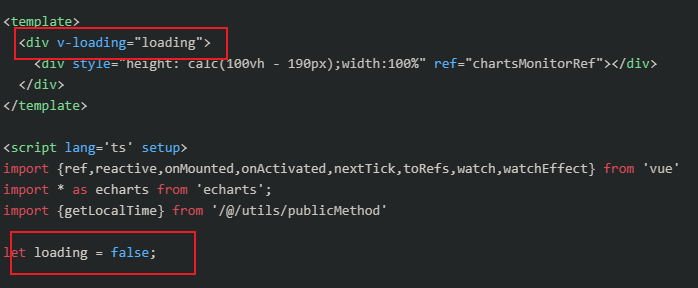
换一个思路, 不给echarts添加loading, 而是给他的外层元素添加loading,正好用的还是elementUI组件库, 它提供了一个属性https://element.eleme.cn/2.3/...
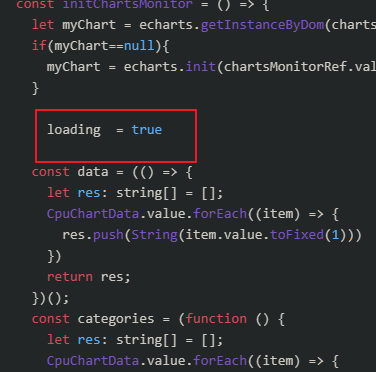
加载echarts前显示loading, 而后myChart.setOption(option);之后再不显示
<template>
  <div v-loading="loading">
    <div style="height: calc(100vh - 190px);width:100%" ref="chartsMonitorRef"></div>
  </div>
</template>

<script lang='ts' setup>
import {ref,reactive,onMounted,onActivated,nextTick,toRefs,watch,watchEffect} from 'vue'
import * as echarts from 'echarts';
import {getLocalTime} from '/@/utils/publicMethod'

let loading = false;

const chartsMonitorRef = ref();
interface Props {
    CpuChartData: {timestamp: number;value:number}[]
}

let props = defineProps<Props>()
const {CpuChartData} = toRefs(props)

watch(
  () => props.CpuChartData,
  (newProps) => {
    initChartsMonitor()
  }
)
const state = reactive({
    myCharts: [] as EmptyArrayType,
});
onMounted(() => {
  initChartsMonitor()
  initEchartsResize();
})
onActivated(() => {
    initEchartsResizeFun();
});
const initEchartsResizeFun = () => {
    nextTick(() => {
        for (let i = 0; i < state.myCharts.length; i++) {
            state.myCharts[i].resize();
        }
    });
};
const initEchartsResize = () => {
    window.addEventListener('resize', initEchartsResizeFun);
};

const initChartsMonitor = () => {
  let myChart = echarts.getInstanceByDom(chartsMonitorRef.value);
  if(myChart==null){
    myChart = echarts.init(chartsMonitorRef.value);
  }

    loading  = true

  const data = (() => {
    let res: string[] = [];
    CpuChartData.value.forEach((item) => {
      res.push(String(item.value.toFixed(1)))
    })
    return res;
  })();
  const categories = (function () {
    let res: string[] = [];
    CpuChartData.value.forEach((item) => {
      res.push(getLocalTime(item.timestamp))
    })
    return res;
  })();
  const option = {
    legend: {},
    grid: {
            top: 30,
            right: 30,
            bottom: 80,
            left: '5%',
        },
    tooltip: {
      trigger: 'axis',
      axisPointer: {
        type: 'cross',
        label: {
          backgroundColor: '#283b56'
        }
      },
      formatter: function (params: any) {
        var relVal = 'CPU'
        for (var i = 0, l = params.length; i < l; i++) {
          relVal += '<br/>' + params[i].marker +params[i].name+ ': ' + params[i].value + '%'
        }
        return relVal
      }
    },
    dataZoom:[{
      show: true,
      start: 0,
      end: 100,
      maxSpan: 100,
    }],
    xAxis: {
      type: 'category',
      boundaryGap: true,
      data: categories.map(function (str) {
        return str.replace(' ', '\n')
      }),
      splitLine: {
        show: true
      }
    },
    yAxis: {
      type: 'value',
      axisLine: {
        show: true
      },
      axisLabel: {
        formatter: function(_value: any) {
          return _value.toFixed(1) + '%'
        }
      }
    },
    series: [
      {
        type: 'line',
        data: data,
        lineStyle: {
          width: 1,
          color: '#f28e2b'
        },
        itemStyle: {
          color: '#f28e2b',
          borderColor: '#f28e2b'
        },
        showSymbol: false,
        areaStyle: {
          opacity: .8,
          color: new echarts.graphic.LinearGradient(0, 0, 0, 1, [
            {
              offset: 0,
              color: '#f28e2b'
            }
          ])
        },
      }
    ]
  };
    myChart.setOption(option);
  myChart.hideLoading()
    state.myCharts.push(myChart);
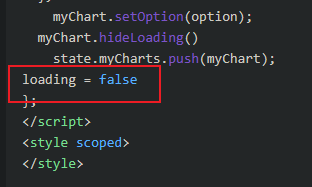
loading = false
};
</script>
<style scoped>
</style>
有什么前端比较好的在线单位转化器吗 rem转px转vh